Open data is being used in this sector for environmental and energy use monitoring, to guide decisions on where and how to invest in energy infrastructure, and to assess the impact of climate change. Environment, energy, and weather data are most used in this sector.
From the U.S. Climate Data Initiative to the UN’s Data for Climate Action program, international experts are turning to open data as part of solutions and approaches to mitigate climate change and provide energy solutions. For instance, environmental data is being used to predict how weather will impact wind, solar, and hydro power projects in order to inform their planning and locations. This data is also being used for wind and solar power forecasting and scheduling. By predicting power output for each source of energy, organizations can anticipate changes to power generation, balance energy supply with demand, and reduce the overall costs of integrating renewable energy sources onto the grid.
While renewable energy resources are being developed, open data is helping utilities providers and consumers manage existing power sources more efficiently. Consumption data is being used to estimate energy use patterns and increase efficiency in the industrial and buildings sector.
Nonprofits are also using open data for environmental monitoring and impact assessment. They use local environmental and ecological information, as well as demographic and social data, to measure air and water pollution and energy usage, and predict the impact of shifts in climatic conditions. They incorporate open data in their research and advocacy work to publish data, analysis, and recommendations.
Types of Data Most Used
Size, Type & Founding Year
How Organizations Use Open Data

Use Cases

Template
Country: United States
Impact: Farmers benefit from tools for better crop management and to measure environmental factors
Data Used: Rainfall data from US National Oceanic and Atmospheric Administration’s (NOAA) National Climatic Data Center, soil data from US Department of Agriculture
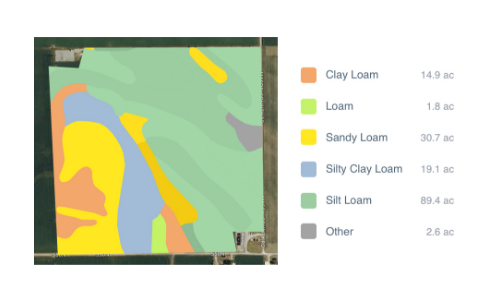
FarmLogs provides farmers with a free software and mobile application to map and analyze crop yields and environmental conditions for crop growth through government data. Their Farmlogs free Standard includes several features: Field Mapping, Scouting and Notes, Activity Tracking, Rainfall Tracking, GDD Accumulation, Soil Composition Maps, Growth Stage Analysis, Yield Maps, Input Planning. They also empower farmers to coordinate with the government to request data for their lands. On their website, FarmLogs details instructions on how to contact the US Department of Agriculture's Farm Service Agency for field boundary data. Upon receipt, FarmLogs interprets the data and creates field boundaries on mapping systems for farmers to demarcate their lands.